What Is Telemetry?
Telemetry is a next-generation network monitoring technology used to remotely collect data from devices at high speed. Devices periodically push device information to a collector, providing real-time, high-speed, and accurate network monitoring. To be specific, telemetry organizes data based on YANG models, encodes data in the Google Protocol Buffers (GPB) format, and transmits data through the Google Remote Procedure Call (gRPC) protocol. This improves data collection efficiency and facilitates intelligent interconnection.
In traditional technologies, a collector and devices interact in pull mode by alternatively sending requests and responses. In contrast to these technologies, telemetry works in push mode and has the following advantages:
- Proactively pushes data, reducing the pressure on devices.
- Pushes data periodically in subseconds to avoid data inaccuracy caused by network delay.
- Is capable to monitor a large number of network devices, improving network monitoring efficiency.
Telemetry vs. SNMP
Simple Network Management Protocol (SNMP) is a mainstream technology that can meet service objectives and network operation requirements on small simple networks. Telemetry, as a rising star, has many advantages over SNMP on large data networks. The following describes the differences between telemetry and SNMP.
- SNMP uses the pull mode, whereas telemetry uses the push mode.
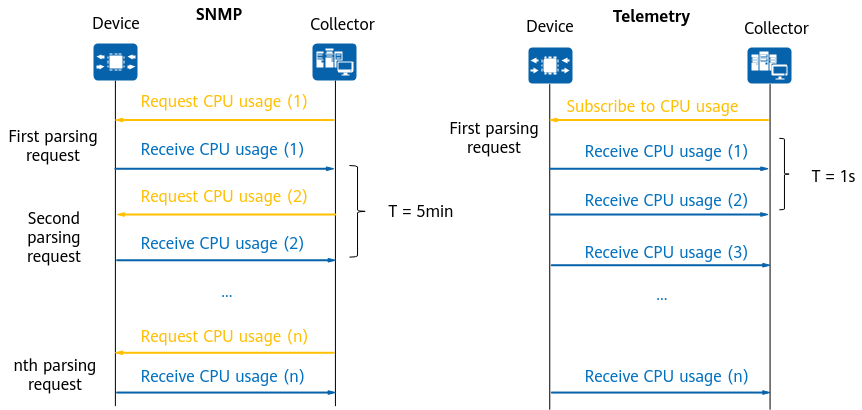
As shown in the following figure, when SNMP collects CPU usage data in pull mode, the device needs to parse a query request each time the collector delivers a query request because the collector and the device interact by alternatively sending requests and responses. That is, the device needs to parse query requests n times if the collector delivers query requests n times. In telemetry that works in push mode, only one subscription request and one parsing request are required to continuously push data to the collector based on the collection period specified during subscription.

SNMP in pull mode and telemetry in push mode
- SNMP uses the MIB-defined data structure, whereas telemetry uses the YANG-defined data structure.
The MIB is an unstructured data model, which is defined by each vendor. That is, if the collector needs to collect data from devices of another vendor, it takes a lot of efforts to learn the MIB model of the vendor. In addition, the object values output by the MIB do not have a clear attribute definition, and are complex to parse. YANG is a structured data model, in which vendors use unified syntax, implementing standardization. In addition, service objects, attributes, and data types can be clearly defined and are easy to parse, without requiring special adaptation.
- The SNMP collection period is in seconds, while the telemetry collection period is in subseconds.
SNMP is based on periodic queries. Therefore, the device cost is high, and the collection period is too long compared with telemetry. As a result, the network status cannot be accurately monitored.
What Are the Applications of Telemetry?
Real-Time Traffic Optimization
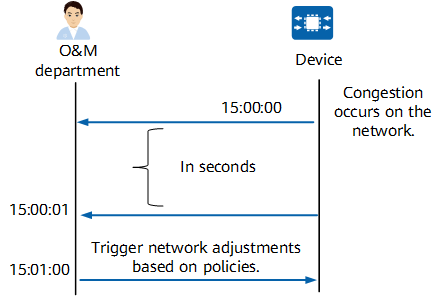
In the past, customer networks used SNMP technology and reported device data every 5 minutes. As a result, the networks cannot support real-time monitoring. When a large amount of data was reported, device performance bottlenecks led to data breakpoints. As shown in the following figure, telemetry technology enables the maintenance department to collect device data in seconds, analyze exceptions in a timely manner, and quickly deliver configurations to adjust devices. In addition, the maintenance platform can receive the adjusted device status in real time, ensuring the healthy running of devices.

Real-time traffic optimization
Microburst Detection
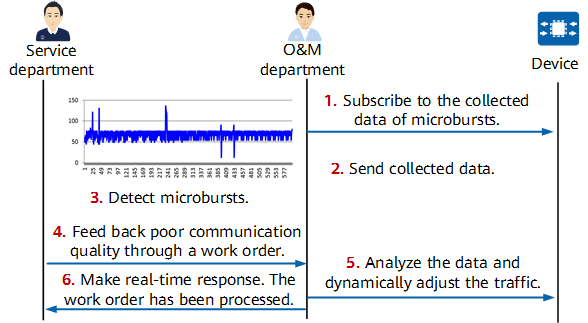
In the past, microbursts occurred on customer networks, and packets exceeding the device forwarding capability were discarded. The more the microbursts, the higher the service retransmission rate, and the poorer the network communication quality. As shown in the following figure, the traffic statistics reported using telemetry show that microbursts occur. These microbursts can be detected through high-precision telemetry-based sampling.

Microburst detection
How Does Telemetry Work?
Telemetry is a closed-loop automatic O&M system, also known as intelligent O&M system. It consists of components, including network device, collector, analyzer, and controller. These components can be third-party or Huawei systems. In Huawei's telemetry system, network devices refer to CloudEngine switches, the collector and analyzer both refer to iMaster NCE-FabricInsight, and the controller refers to iMaster NCE-Fabric.
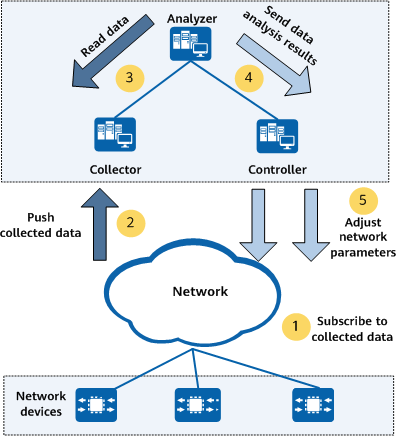
As shown in the following figure, the implementation of a telemetry system consists of five stages:
Subscribe to collected data: The collected device data and the data to be collected need to be subscribed to. For details, see Which Data Subscription Methods Are Available?.
- Push collected data. A device sends collected data to the collector based on the data subscription mode. The collector then receives and stores the data.
- Read data. The analyzer reads the collected data stored in the collector.
- Analyze data. The analyzer analyzes the collected data and sends the analysis results to the controller for network configuration, management, and optimization.
- Adjust network parameters. The controller delivers the adjusted network configurations to devices. After these configurations take effect, the devices report new collected data to the collector. The analyzer analyzes whether the network optimization result meets expectations. The service process is complete once optimization is complete.

Implementation of the telemetry system
Which Data Subscription Methods Are Available?
Data subscription is essential in the telemetry system. There are two data subscription mechanisms:
- Static subscription: The device functions as the client, and the collector functions as the server. The device proactively establishes a connection with the collector and pushes collected data to the collector. The data to be collected is configured using commands on the device.
- Dynamic subscription: The collector functions as the client, and the device functions as the server. The collector proactively establishes a connection with the device, and the device pushes collected data to the collector. The data to be collected is dynamically configured by the collector and delivered to the device.
If a network device is disconnected from the collector, in static subscription mode, the device will reconnect to the collector and send collected data to the collector again. In dynamic subscription mode, the device will cancel dynamic subscription and no longer send collected data to the collector. Therefore, static subscription features continuous data collection and push and is suitable for subscription of data that needs to be collected for a long time. Dynamic subscription features special collection and on-demand push and is suitable for subscription of data that needs to be collected temporarily.
- Author: Yu Lingling
- Updated on: 2024-02-27
- Views: 38383
- Average rating:


